
On 4 August 2026 the water gauge at Kaub, a small town on the Rhine in Germany, read 21 centimetres: the lowest level since records began in 1880. Most of the coverage focused on that figure. The date deserves more attention than the number. In 2018, the last time the river came close to this low, it did not reach a comparable level until late October, at the end of the dry season and within weeks of the autumn rain that normally refills it. This year the river arrived there in the first week of August, with the hottest weeks of summer still ahead and the usual low-water season not yet begun.
The Rhine, and why one gauge controls it
The Rhine rises as Alpine meltwater in Switzerland and runs roughly 1,200 kilometres north to the North Sea, flowing through or alongside Switzerland, France, Germany and the Netherlands before reaching the sea at Rotterdam. For most of that distance it is not simply a river: it is one of the busiest and most important freight routes in Europe, linking the continent’s two largest seaports, Rotterdam and Antwerp, to industrial regions of Germany, France and Switzerland that otherwise sit far from any coast.
Nearly every kind of good moves on it. The Rhine carries chemical feedstocks and refined fuel, coal and metal ores, grain and other agricultural products, sand, gravel and cement, shipping containers full of consumer goods and machine parts, and oversized industrial equipment too large to move easily by road or rail, such as components for wind turbines and power stations. In 2024 the river carried 284.5 million tonnes of freight, more than any other inland waterway in Europe. Much of that cargo has no practical substitute: it either moves by barge, or it does not move at all, at any reasonable cost.

Figure. The Rhine’s course from Basel to the North Sea. Kaub sits on the Middle Rhine, between Koblenz and Mainz. Base geographic data: Natural Earth.
Kaub is an important point for Rhine transportation because of what the riverbed looks like there. The Middle Rhine narrows and shallows at Kaub more than at almost any other navigable point on the river, so it forms a natural bottleneck. A ship cannot choose how deep the water is at the shallowest point of its route: it must load according to that point, whatever the depth happens to be at the ports and along the rest of the river either side of it. Because Kaub is consistently the shallowest, narrowest stretch between Rotterdam and southern Germany, a gauge reading taken at this one town effectively sets the maximum cargo for every vessel on the entire corridor, regardless of how deep the water is where each ship starts and finishes its journey. That is why a single reading from a single small town can make international headlines: it is the number the whole river currently has to obey.
What the gauge actually measures
A gauge reading is a water level measured against a fixed local marker, not the true depth of water available to a ship’s hull; the real channel runs deeper than the number alone suggests. What matters commercially is draught: how far a loaded vessel sits below the waterline, and therefore how much cargo it can carry without touching the riverbed. Because Kaub is the shallowest point on the route, its gauge is the one that decides how much draught, and so how much cargo, every passing vessel can safely carry for the whole trip.
The long-term average water level at Kaub is 208 centimetres. The reference level used for loading decisions is 78 centimetres, a mark the river clears on all but roughly twenty days in a normal year. This summer the fall has been steady rather than sudden: about 140 centimetres in late May, 106 on 22 June, 40 by mid-July, 25 at the start of August (matching the 2018 record), then 24 on the Monday and 21 overnight into 4 August. Forecasts point to something near 17 centimetres within the week. Cologne and Lobith, further downstream, have also set series lows, and inflow into the river has been running near 692 cubic metres per second against roughly 1,900 for the time of year.
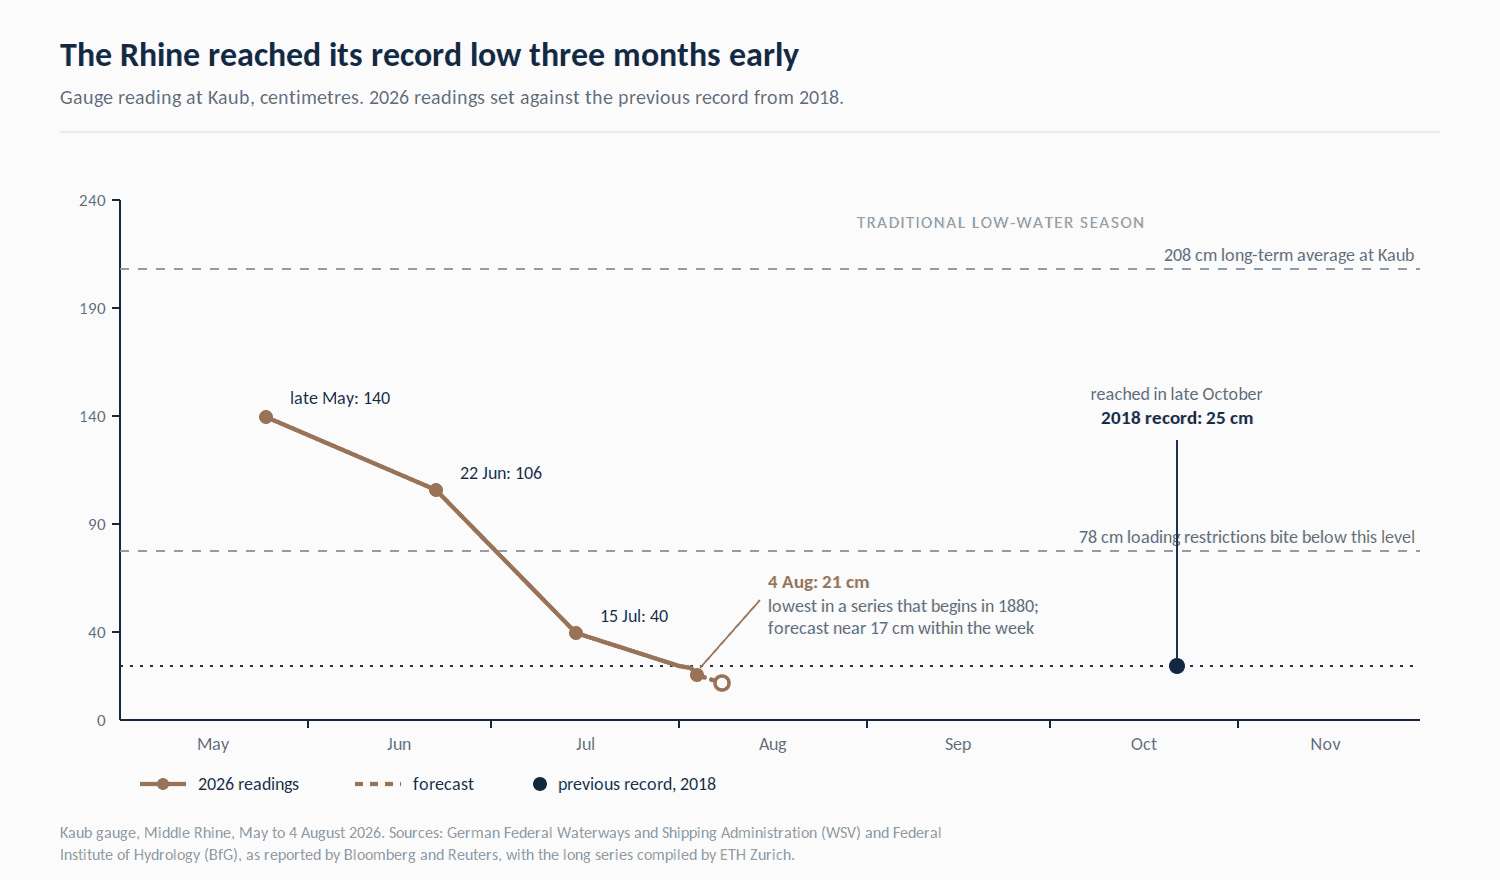
Figure. Kaub gauge readings, May to 4 August 2026, against the previous record. Sources: WSV and BfG data as reported by Bloomberg and Reuters, with the long series compiled by ETH Zurich.
The corridor narrows long before the river closes
The Rhine is still open to traffic. What has collapsed is how much each ship can carry. Vessels that would normally pass Kaub carrying around 5,100 tonnes have been moving roughly 800. A container barge that normally takes about 500 boxes is taking about 100. Freight from Rotterdam to points south of Kaub has gone from something near 20 euro a tonne to something near 150, low-water surcharges have passed 1,100 dollars a container, and the cost of moving diesel from Rotterdam to Karlsruhe is the highest since Bloomberg began compiling that series in 2009.
There is no clean substitute for this lost capacity. Replacing a single normal barge-load can take more than a hundred trucks, and rail paths, wagons and terminal slots are already committed elsewhere. The exposure runs well past German industry: Switzerland receives around thirty per cent of its mineral oil products up the Rhine from the Amsterdam, Rotterdam and Antwerp hub, so a shallow river in Germany becomes a fuel-supply question in a country the Rhine does not even reach.

Figure. Capacity and price at the Kaub chokepoint. Sources: Bloomberg, Reuters and the Koblenz Chamber of Industry and Commerce, 30 July to 4 August 2026.
What it cost the last time
The most careful published estimate comes from the Kiel Institute, where Ademmer, Jannsen and Kooths measured the effect of Rhine navigability on German industrial output. In a month with thirty days below 78 centimetres at Kaub, industrial production falls by about one per cent. During the worst of 2018, production in the Rhine corridor was down around 1.5 per cent year on year.
The figure that circulates most widely, a 0.4 per cent hit to German GDP, is a secondary estimate rather than a directly measured result, and published estimates of the 2018 episode range from roughly 0.2 to 0.4 percentage points of growth depending on method and period. The direction of the effect is not in dispute; the precision commonly quoted around it is worth treating with care. For the current episode, economist Stefan Kooths has put the drag at 0.1 to 0.2 percentage points on third-quarter growth.
Company-level damage in 2018 was easier to count. BASF reported an earnings impact of around 250 million euro. Thyssenkrupp declared force majeure (a legal notice that unforeseeable events have made a contract impossible to fulfil as agreed) when raw material deliveries failed, and has since chartered a train able to bring in roughly 3,000 tonnes of coal a day as a standing backup. Covestro moves more than thirty per cent of its finished goods, and most of its raw materials, by river.
That investment matters for how this summer should be read. Producers have spent the years since 2018 on low-water vessels, standing rail contracts and larger inventories, and the 2022 drought was absorbed far better than 2018 despite broadly comparable conditions. Analysts covering the chemicals sector currently see the risk weighted towards higher logistics costs and supply-chain friction rather than a repeat of outright operational failure. The caveat is that the models behind these estimates were built on episodes less extreme than this one, so their reliability at record-low levels is itself untested.
The carbon that a dry river creates
Inland shipping is one of the few parts of European freight that already moves the way climate policy wants freight to move. On German Environment Agency figures, moving one tonne of cargo one kilometre by barge accounts for about 34 grams of CO2 equivalent, against 119 grams by heavy goods vehicle; rail is lower still, at about 20 grams. (A “tonne-kilometre” is simply the standard unit for comparing freight efficiency: one tonne of cargo moved one kilometre.)
That efficiency gap is what a drought converts into extra emissions. Take a normal shipload of 5,100 tonnes moved 500 kilometres. By water it accounts for roughly 87 tonnes of CO2 equivalent. By road, the same cargo over the same distance accounts for roughly 303 tonnes. The difference, about 217 tonnes, is the carbon price of one shipload being forced off the river, and the Rhine carried 284.5 million tonnes of freight in 2024 in total.
Two things make the real picture worse than that simple arithmetic, and one makes it slightly better. A part-loaded barge burns close to the fuel of a full one, so the river fleet emits more per tonne-kilometre in exactly the weeks when it is carrying the least; and cargo that cannot move at all is often displaced into longer, less efficient supply arrangements rather than a single direct substitute. Working the other way, road routes are usually shorter than the river route, and some of the displaced volume goes to rail rather than to trucks. The mechanism itself is what deserves attention: climate stress is degrading the lowest-carbon freight mode and pushing cargo towards the highest-carbon one, which is the opposite of what modal-shift climate policy is designed to achieve.
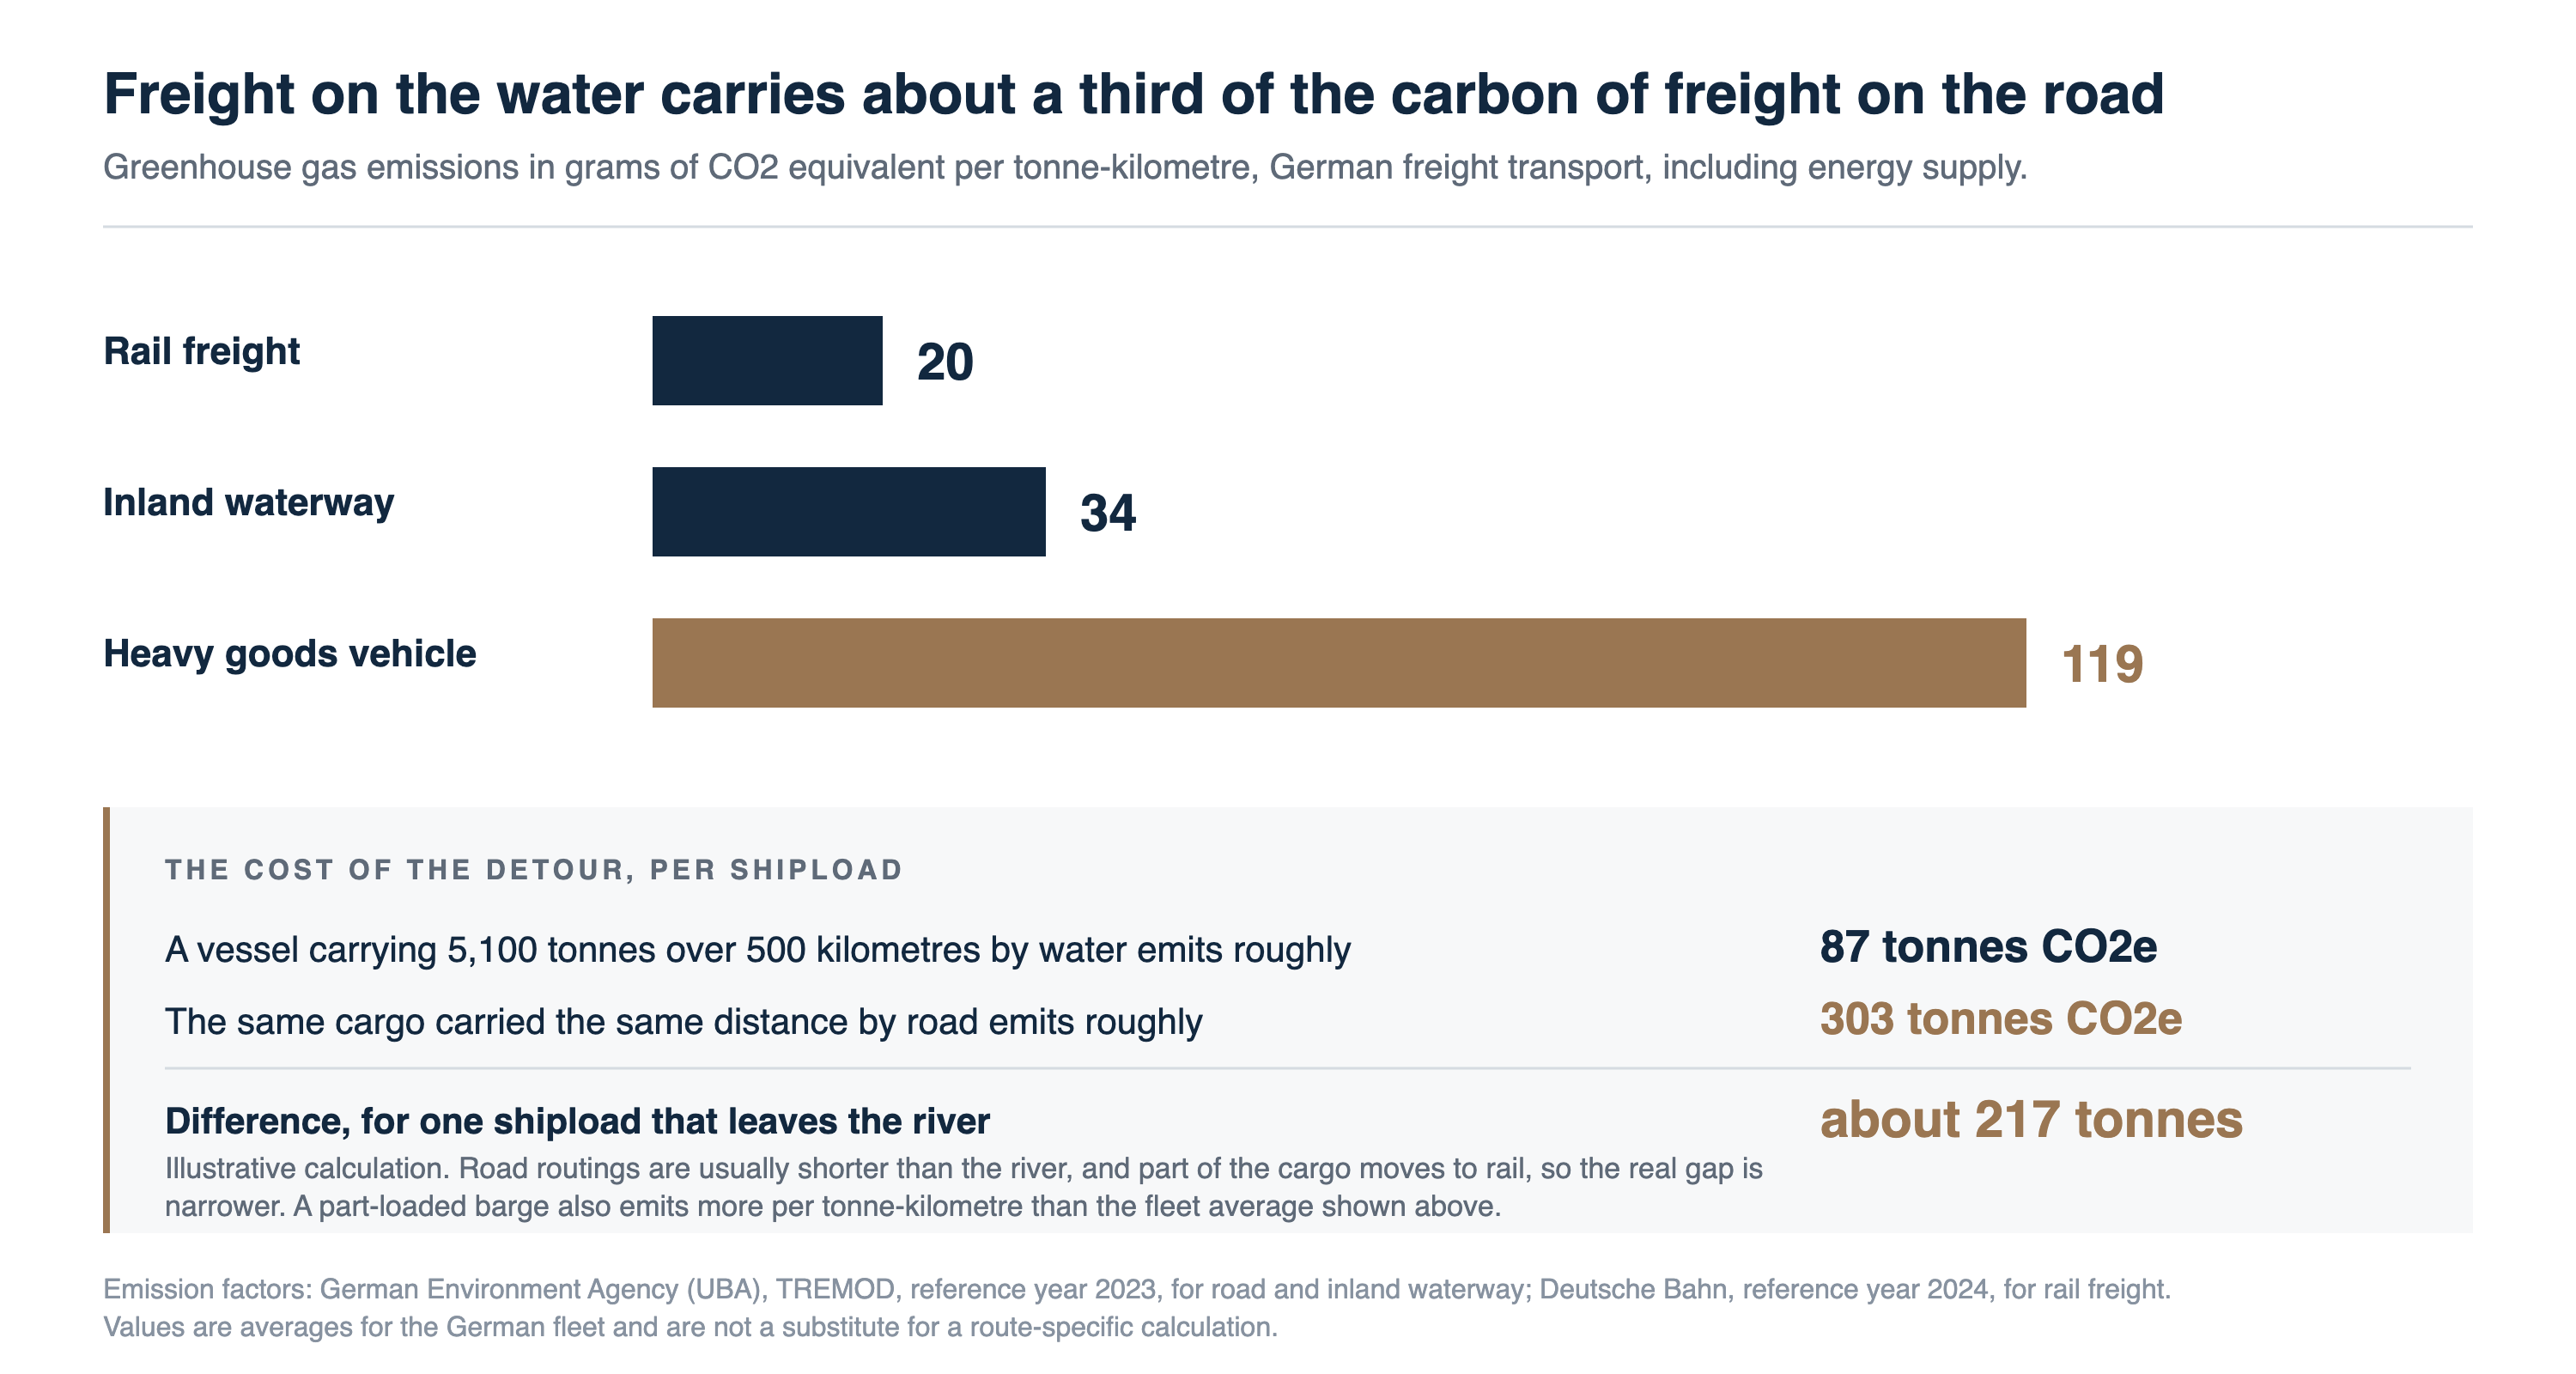
Figure. Emission factors: UBA TREMOD, reference year 2023, for road and inland waterway; Deutsche Bahn, reference year 2024, for rail. The shipload comparison is illustrative.
Infrastructure that nobody built for this
The Rhine is often treated as a natural feature and used like a piece of capital equipment. It has been dredged, straightened and engineered since the nineteenth century, and work continues today: a project to deepen the Middle Rhine by a further twenty centimetres is under way and is not expected to finish until 2033. Renewing the barge fleet towards hulls suited to low water runs on a similar timescale. Basin-wide water management, including more deliberate use of Alpine and reservoir storage, is under study at the International Commission for the Protection of the Rhine.
Every one of those responses is measured in years. The water disappears in weeks. That mismatch is the practical definition of an infrastructure gap, and it is the reason the corridor cannot be fixed inside a single dry summer, however it is funded.
How much weight should the record carry?
- A gauge reading in 2026 and a gauge reading in 1880 do not describe the same channel. Continuous engineering work has changed the riverbed, the training structures and the flow regime, so “lowest since records began” is a real signal, but one that needs a qualification rather than a headline standing on its own.
- Duration is the variable that actually decides the economic outcome, and it is unknown in advance. A fortnight of steady rain in the southern catchment would change the picture quickly.
- The published economic estimates are out of sample. Water levels this low, arriving this early in the season, sit outside the range the Kiel Institute’s model was fitted on, which could make the real impact better or worse than the estimate suggests.
- Mitigation since 2018 is genuine, and it is unevenly distributed. Large chemical producers have alternatives such as standing rail contracts and larger stockpiles. Smaller shippers and inland ports typically have fewer.
The point that outlasts the summer
Europe tends to count its logistics in ports, motorways and rail corridors, and to treat its rivers as scenery. The numbers say otherwise. The Rhine moves more freight than any other inland waterway on the continent, at roughly a third of the carbon intensity of a truck, and for as long as the water is there it does that work quietly and cheaply. A summer like this one puts a price on a service the river usually provides for nothing. It is one of the arteries of the European economy, carrying the raw materials, fuel, food and finished goods that keep factories in three countries running, and an artery makes itself known once it narrows.
References
- German Federal Waterways and Shipping Administration (WSV) and Federal Institute of Hydrology (BfG), Kaub gauge readings and 14-day probabilistic forecasts, July and August 2026; long series compiled by ETH Zurich.
- Bloomberg, reporting on Kaub levels, barge payloads and freight rates, 3 and 4 August 2026; Reuters, 30 July 2026.
- M. Ademmer, N. Jannsen and S. Kooths, Low water levels and economic activity: the case of the Rhine river, Kiel Working Paper 2155, Kiel Institute for the World Economy.
- BASF SE, Annual Report 2018, on the earnings impact of the 2018 low-water period.
- Central Commission for the Navigation of the Rhine (CCNR), Annual Report 2025, inland navigation in Europe: 284.5 million tonnes carried on the Rhine in 2024.
- German Environment Agency (UBA), TREMOD emission factors, reference year 2023; Deutsche Bahn AG, rail freight factor, reference year 2024.
- ING Think, Low water levels and the German economy, 3 August 2026.
- Map base data: Natural Earth, public domain geographic dataset.
Read further
- Why under-packaging is the costlier environmental mistake
- Empty space in food packaging: when it is waste, and when it is the whole point
This article reflects independent professional analysis and is provided for informational purposes. It does not constitute investment, legal or operational advice, or an official position of any organisation. Gauge readings and freight figures describe a fast-moving situation as reported up to 5 August 2026 and will have changed. Emission and cost comparisons are illustrative averages rather than route-specific calculations. Last reviewed August 2026.